
Just about everyone has heard of the “food dollar,” which represents $1 spent on food in the United States. There are lots of costs to producing food and many different businesses and people have a hand in getting our food from the farm to the store. Looking at the breakdown of the food dollar shows us where the money we spend on food truly goes.
According to the U.S. Department of Agriculture, there are three different ways to break down the food dollar, which describe different aspects of the food supply chain. And we can learn different things from each of them.
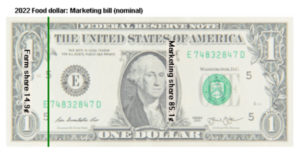
The marketing bill series breaks down the dollar into two things: the farm share and the marketing share. The farm share measures the amount of farm commodity sales, and the marketing share is the market value added to farm commodities. The most recent data about food dollars is from 2022.
In 2022, the farm share was 14.9 cents of each food dollar expenditure and the marketing share was 85.1 cents. That is close to a record low for farmers.
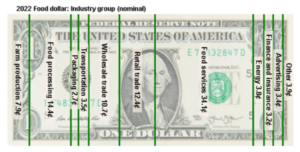
The industry group series breaks down the food dollar a lot further, into all the different products or types of services provided. Here are the groups that this version of the food dollar is broken into:
- Agribusiness — all places producing farm inputs (except those described in other industry groups) like seed, fertilizers, farm machinery, and other farm services.
- Farm production — all establishments classified as farms in the agriculture, forestry, fishing, and hunting industries.
- Food processing — all food and beverage manufacturing locations.
- Packaging — all establishments that package, container, and do print manufacturing for food.
- Transportation — all places that provide transportation and freight services.
- Wholesale trade — all non-retail establishments that resell products for the purpose of contributing to the U.S. food supply.
- Retail trade — all food retailing and related establishments.
- Food service — all restaurants and other eating and drinking establishments.
- Energy — oil and coal mining, gas and electric utilities, refineries, and related establishments.
- Finance and insurance — all financial services and insurance carrier establishments.
- Advertising — all advertising services.
- Legal and accounting — establishments that provide legal, accounting, and bookkeeping services.
In 2022, 7.9 cents out of each dollar went directly to farm production. If you’re wondering why this looks different from the 14.9 cents toward farms in the marketing bill series (above), this implies that 7 cents (from the 14.9 cents above) was used to purchase products from the other industry groups (such as energy or transportation).
Also in 2022, 2.1 cents went toward agribusiness, 14.4 cents of each dollar went to food processing, 12.4 cents went toward retail trade, and 34.1 cents went to foodservice establishments. Additionally, 10.7 cents was for wholesale trades. Packaging and transportation accounted for 2.7 and 3.5 cents respectively. Then 3.8 cents went toward energy, 3.2 cents went toward finance and insurance, 3.4 cents went to advertising, and 1.8 cents went toward legal and accounting services.
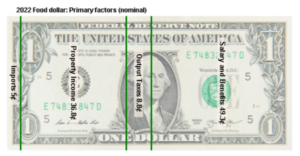
The final way to break down the food dollar is called the primary factor series. In this series, the dollar is broken down into four categories:
- Salary and benefits for domestic labor
- Property income on services due to machinery, equipment, structures, natural resources, product inventory, and other assets
- Output taxes including excise, sales, property, and severance taxes (less subsidies), customs duties, and non-tax fees from Federal, State, and local governments
- Imports of items that support the U.S. food supply
With this breakdown, salary and benefits account for 49.3 cents, property income is 36.8 cents, output taxes make up 8.8 cents, and finally, imports account for 5 cents of the food dollar.
There are lots of different ways to break down the food dollar, and each of these series can tell us something different. For each dollar you spend on food, only 7.9 cents goes directly to farms. Of course there are lots of industries that are a part of bringing food to the table, who all deserve to have a part of the food dollar. This also means that farmers don’t receive much in relation to the full cost of food that consumers pay.
If you notice rising food prices at the grocery store, don’t jump straight to blaming a farmer! Often, factors such as consumer demand for convenience drive up the price of food on the marketing and packaging end (like buying boneless, skinless chicken breast tenders instead of a whole chicken), and that inherently means farms get a smaller overall percentage. Remember, less than 8 percent of food costs go to farmers, so don’t think that farmers and ranchers are the ones getting rich when food prices go up. (Although they likely should be!)
Looking at the breakdown of the food dollar is a great way to truly see how many people play a role in getting from where it starts to our plates.
Michelle Miller, the Farm Babe, is a farmer, public speaker, and writer who has worked for years with row crops, beef cattle, and sheep. She believes education is key in bridging the gap between farmers and consumers.


